How to Understand the Valuation of Funds
I. Excellent Valuation Products
In “Investing in Fixed - Amount for Ten Years to Achieve Financial Freedom” and “Guide to Index Fund Investment”, Luosiding (also known as “Dingda”) has mentioned more than once the importance of investing in combination with valuation. To this end, he publishes a fund valuation table compiled by himself on his WeChat official account Yinhang Luosiding every trading day. The latest issue is already the 2281st.
This is the valuation table released by Dingda last night (2023 - 11 - 21). Green indicates undervaluation, yellow indicates a medium - level value, and red indicates overvaluation.
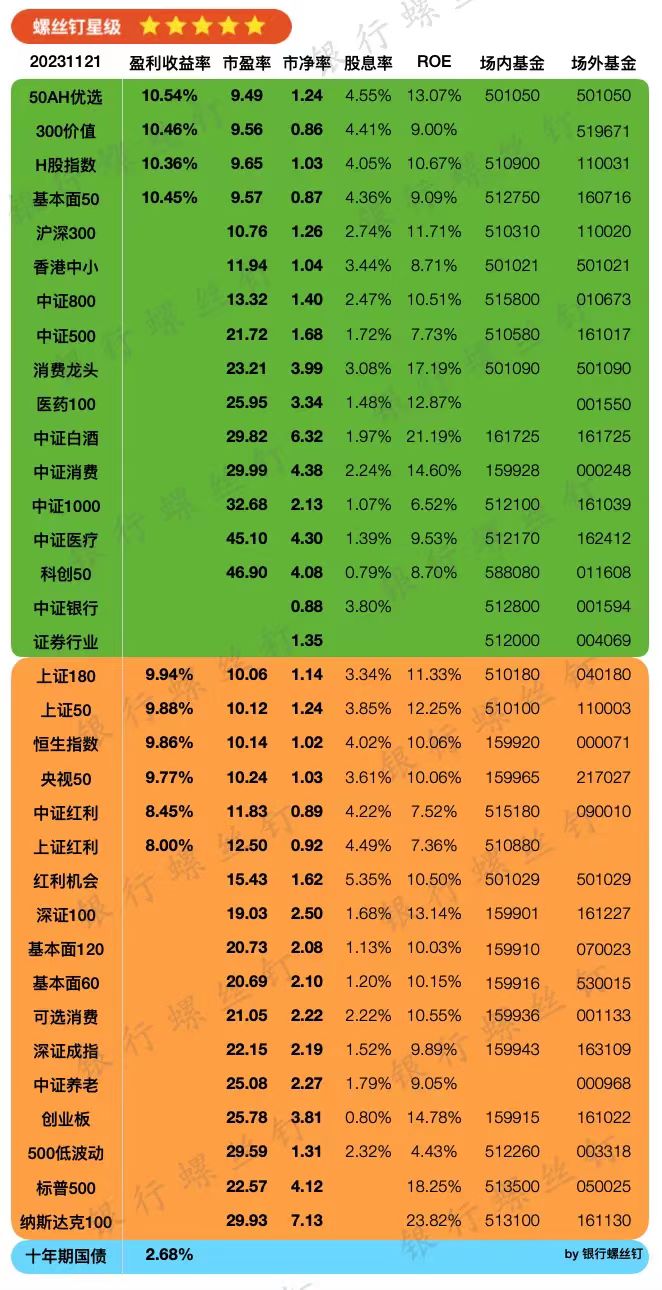
In addition to this valuation table, Dingda has also created a Screwstar Rating. Simply put, there is an algorithm that combines some indicators and finally turns them into a specific number. The value range of this number is 0 - 5.X. The larger the value, the more favorable the current moment is for investment. You can search for the mini - program “What Star Today” on WeChat to learn more about it.
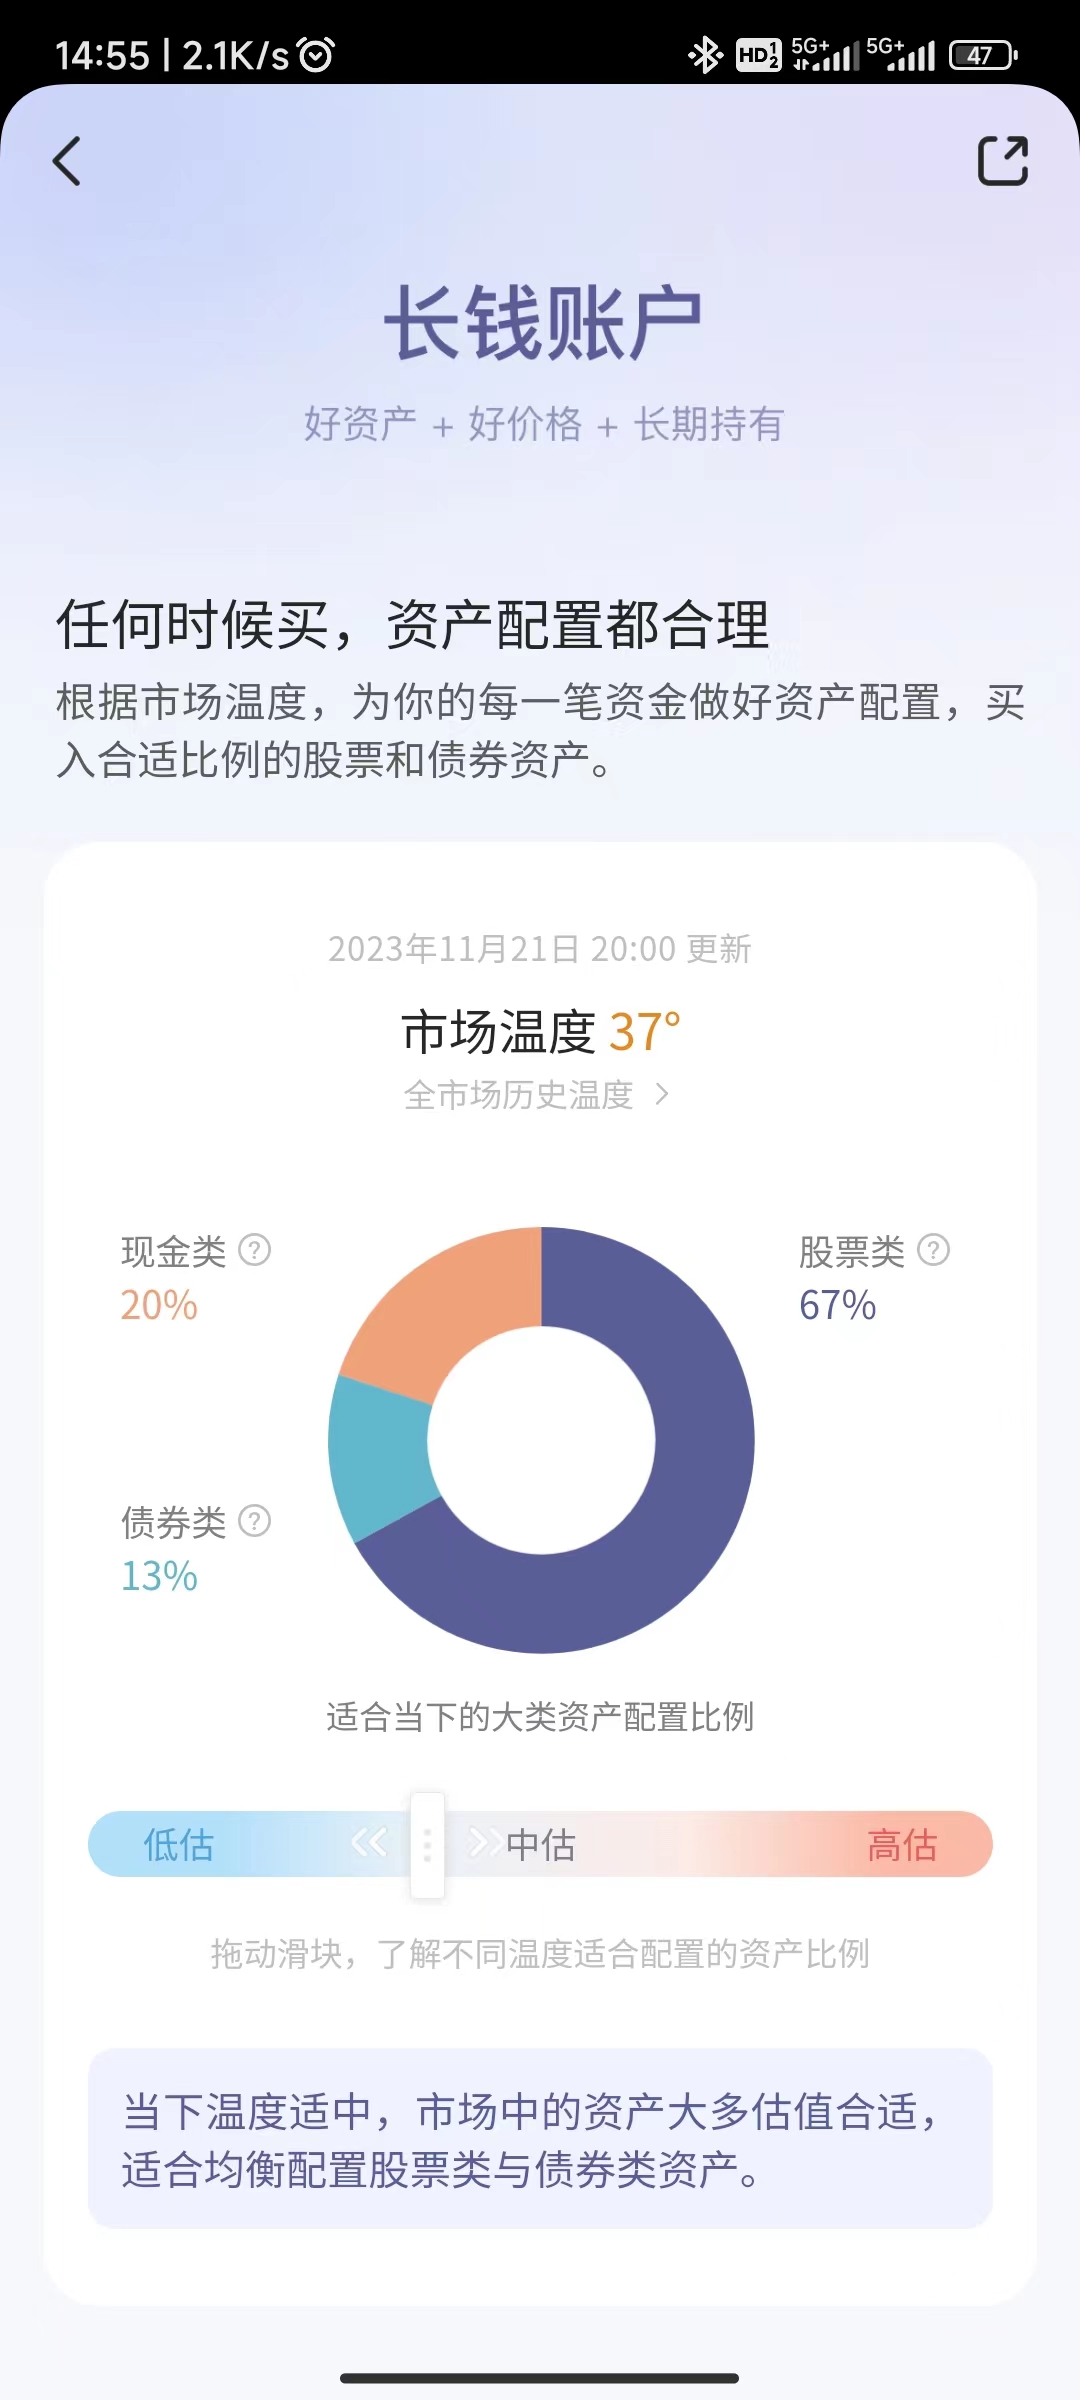
Another big shot I like very much, Meng Yan, has developed a Market Temperature module in his Youzhiyouxing app. Personally, I feel that it is essentially very similar to Dingda’s What Star Today, as shown below.
II. Commonly Used Valuation Indicators
Whether it is What Star Today or Market Temperature, they more or less use some indicators at the bottom.
1. Price - Earnings Ratio (PE)
PE is the abbreviation of Price/Earnings Ratio, and it is often directly called the price - earnings ratio. This is an important indicator for evaluating a company’s financial situation and the investment value of its stocks.
The formula for calculating the price - earnings ratio: PE = Market Price per Share / Earnings per Share
In one sentence, it means that if the current earnings per share remain unchanged, how many years it will take for investors to get their money back.
For a simple (not entirely accurate) example, assume you want to open a fruit store, which requires an investment of 500,000 yuan and can earn 100,000 yuan per year. It will take 5 years to get your money back, and this 5 - year period is the price - earnings ratio.
Generally speaking, a low price - earnings ratio is more favorable for investors.
2. Price - to - Book Ratio (PB)
PB is the abbreviation of Price/Book ratio, and it is often directly called the price - to - book ratio.
The formula for calculating the price - to - book ratio: PB = Market Price per Share / Book Value per Share
“Book Value per Share” refers to the total assets of the company minus all liabilities, and then divided by the total number of shares issued by the company. In other words, if the company liquidates, how much money each shareholder can theoretically get.
For example, assume that the net asset per share of Company A is 20 yuan, and the current share price per share is 16 yuan. Then the price - to - book ratio is 16/20 = 0.8
The price - to - book ratio reflects the market’s judgment and expectation of the company’s intrinsic value. If a company’s price - to - book ratio is low, it may indicate that the company’s stock is undervalued compared to its book value; conversely, if the price - to - book ratio is high, it may mean that the company’s stock is overvalued relative to its book value.
Generally speaking, a low price - to - book ratio is also more favorable for investors.
3. Return on Equity (ROE)
ROE is the abbreviation of “Return on Equity” in English.
The formula for calculating ROE: ROE = Net Profit / Average Shareholders’ Equity
From an investor’s perspective, ROE reflects the efficiency of a company in using its own capital to earn profits. Specifically, a higher ROE value may indicate that the company is more effective in creating profits and providing better returns to shareholders. Conversely, a lower ROE may mean that the company is not using its funds effectively.
4. Dividend Yield
The dividend yield, also known as the dividend payout ratio or dividend rate of return, is an indicator that measures the proportion or degree to which a company pays cash profits to its common shareholders.
It is often used to estimate a company’s dividend policy - especially for those companies whose main goal is to return to investors rather than reinvest in their own growth and expand their product lines.
The formula for calculating the dividend yield: Dividend Yield = Dividend per Share / Price per Share
A high dividend yield may mean that the company is returning more of its profits directly to shareholders in the short term instead of reinvesting them in manufacturing operations or expanding the business. These companies are usually stable and have sufficient cash flow to pay higher dividends.
However, please note that various factors can affect a company’s dividend policy. For example, start - up companies or companies in a high - growth stage rarely pay dividends because they need to retain as much capital as possible in the company for reinvestment and expansion. On the other hand, blue - chip stocks usually pay higher dividends because as mature companies, their growth expectations are usually relatively low.
III. Index Valuation of Tiantian Fund
Whether it is What Star Today or Market Temperature, you can only see a static number at the current moment.
There is a module called Index Treasure in the Tiantian Fund app. It has made valuation curves for common indexes in the market, and you can see the valuation trends and percentile situations over many years in the past.
The following picture is its statistics on the CSI 300 index.
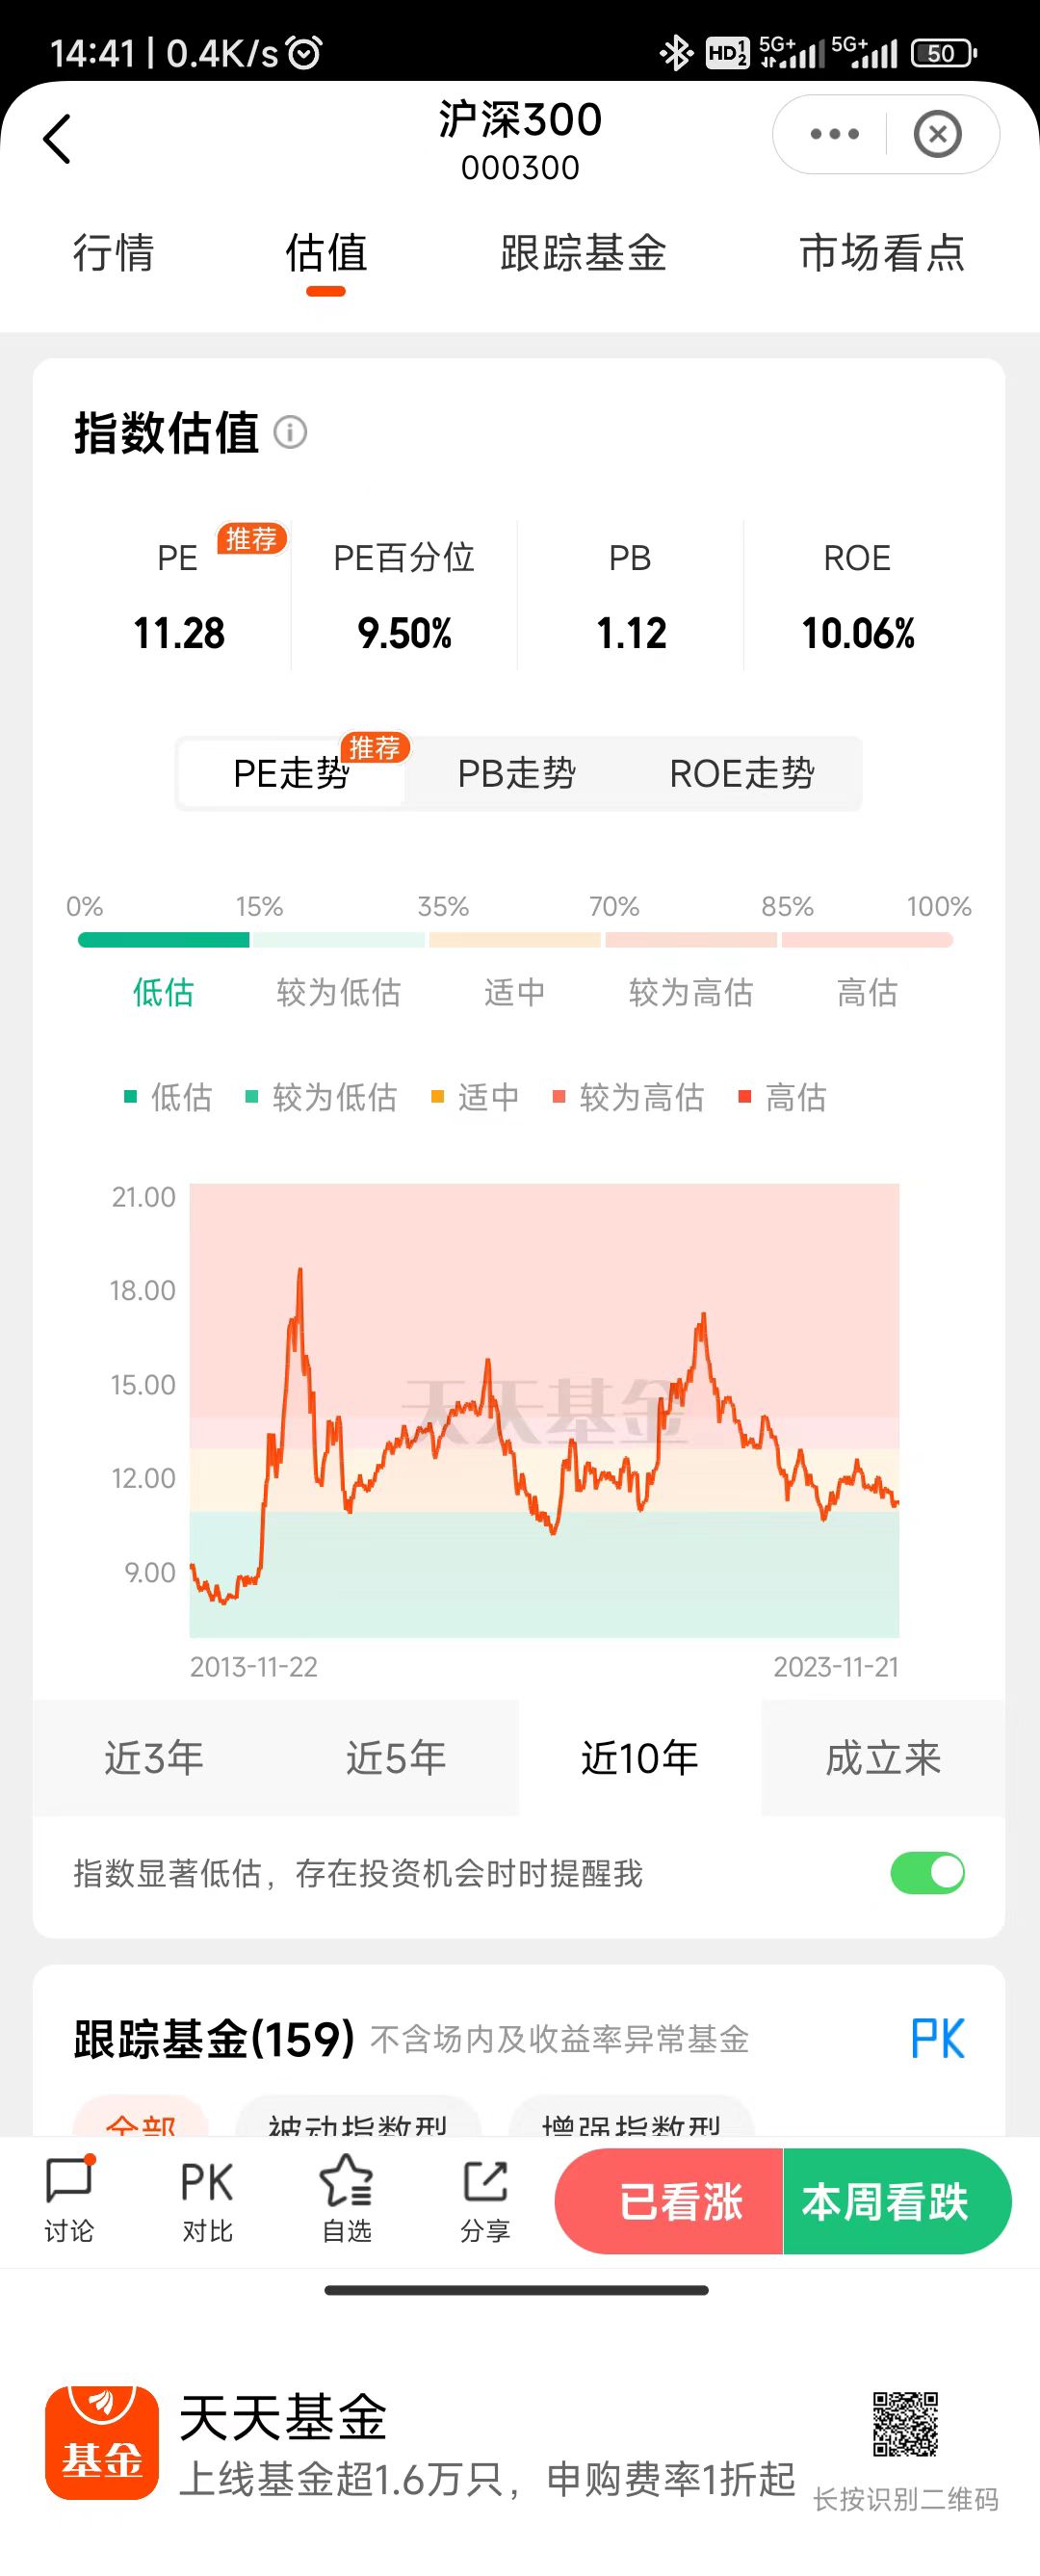
As you can see, there are three indicators: PE, PB, and ROE. Each indicator has a trend curve and a percentile value. The screenshot shows that the current PE percentile of the CSI 300 is 9.5%, which can be understood as the current valuation of the CSI 300 is cheaper than 90.5% of the time in the past 10 years.
Tiantian Fund divides the percentile range of 15% - 35% as a relatively undervalued range, and the percentile range of 0 - 15% as an undervalued range. In fact, this is very similar to What Star Today and Market Temperature, all providing an intuitive conclusion to tell investors whether they should invest during the current period.