Common Index Funds
Most of the content in this blog comes from the chapter “Common Broad-based Indices” in Bank螺丝钉’s books “Financial Freedom through Ten Years of Regular Investment” and “Index Fund Investment Guide”. I recently read these books for the third time and decided to take some notes to deepen my impression.
Many parts of the blog are excerpted from the books. Regarding copyright issues, I have obtained permission from Bank螺丝钉.
Classification Methods of Index Funds
Index funds generally have two classification methods: broad-based index funds and sector index funds; market-cap weighted and strategy weighted.
1. Sector Index Funds
Sector index funds, as the name implies, limit investments to a specific sector when investing. Well-known examples include the consumer sector and the pharmaceutical sector.
2. Broad-based Index Funds
In contrast to sector index funds, funds with no investment restrictions are broad-based index funds. The most famous ones are probably the CSI 300 and CSI 500.
3. Market-cap Weighted Index Funds
Market-cap weighted is somewhat similar to the concept of “weighted average” in mathematics. The larger the market capitalization, the higher the proportion.
In all investment markets around the world, market-cap weighted index funds are the mainstream.
4. Strategy Weighted Index Funds
Strategy weighted has another name, the Smart-Beta index.
As the name suggests, the stock selection of such funds depends on the subjective ideas of some people. They formulate certain rules and then screen for stocks that meet the rules for investment.
For example, the dividend index determines the weight according to the dividend yield. The higher the dividend yield of a stock, the greater its weight.
CSI 300 and CSI 500
Bank螺丝钉 introduced various index funds in great detail in the books. However, as an ordinary investor, it’s difficult to understand all types of indices in detail. But the CSI 300 and CSI 500 are indices that one must understand.
1. CSI 300
The CSI 300 index is a representative index that comprehensively reflects the large-cap stocks in the Chinese stock market on the Shenzhen Stock Exchange and the Shanghai Stock Exchange. It consists of the 300 largest stocks after excluding ST, *ST, unlisted stocks, and some newly listed stocks from all A-shares, aiming to reflect the overall performance of a group of the most representative listed companies in the Chinese A-share market.
The constituent stocks of the CSI 300 index are weighted by market capitalization, with the weights ranked from largest to smallest. The constituent stocks of the CSI 300 index are mainly concentrated in industries such as finance, consumption, and industry.
In terms of market capitalization scale, the stocks of the CSI 300 index account for more than 60% of the total scale of the domestic stock market.
I use Tiantian Fund as an investment platform. It has a lot of information such as the market trends and valuations related to indices, which is very convenient. For example, the following picture is the trend chart of the CSI 300 I saw today.
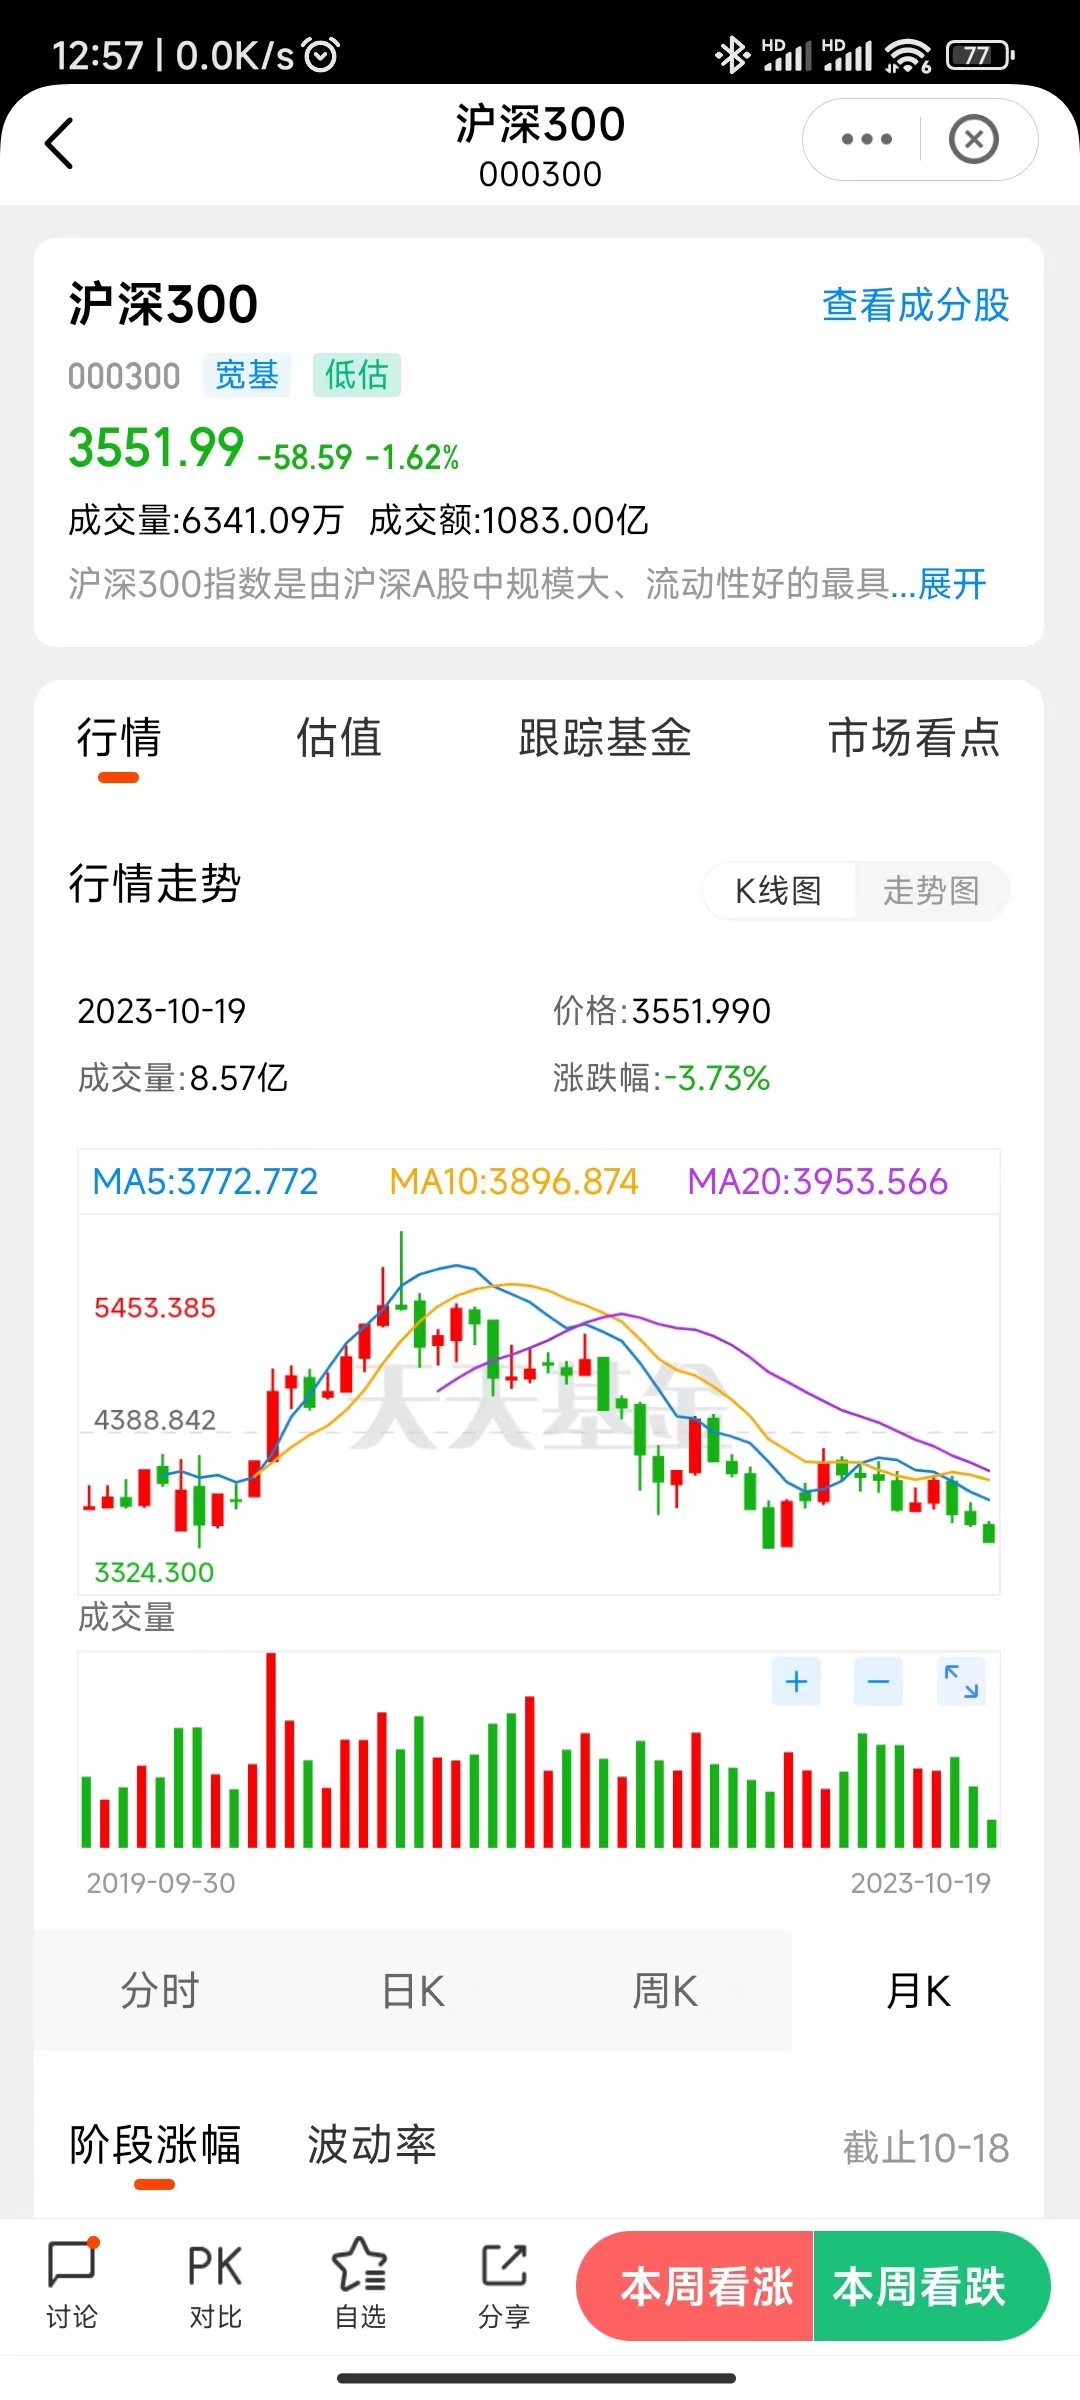
Compared with the market trend, the valuation trend chart is more important.
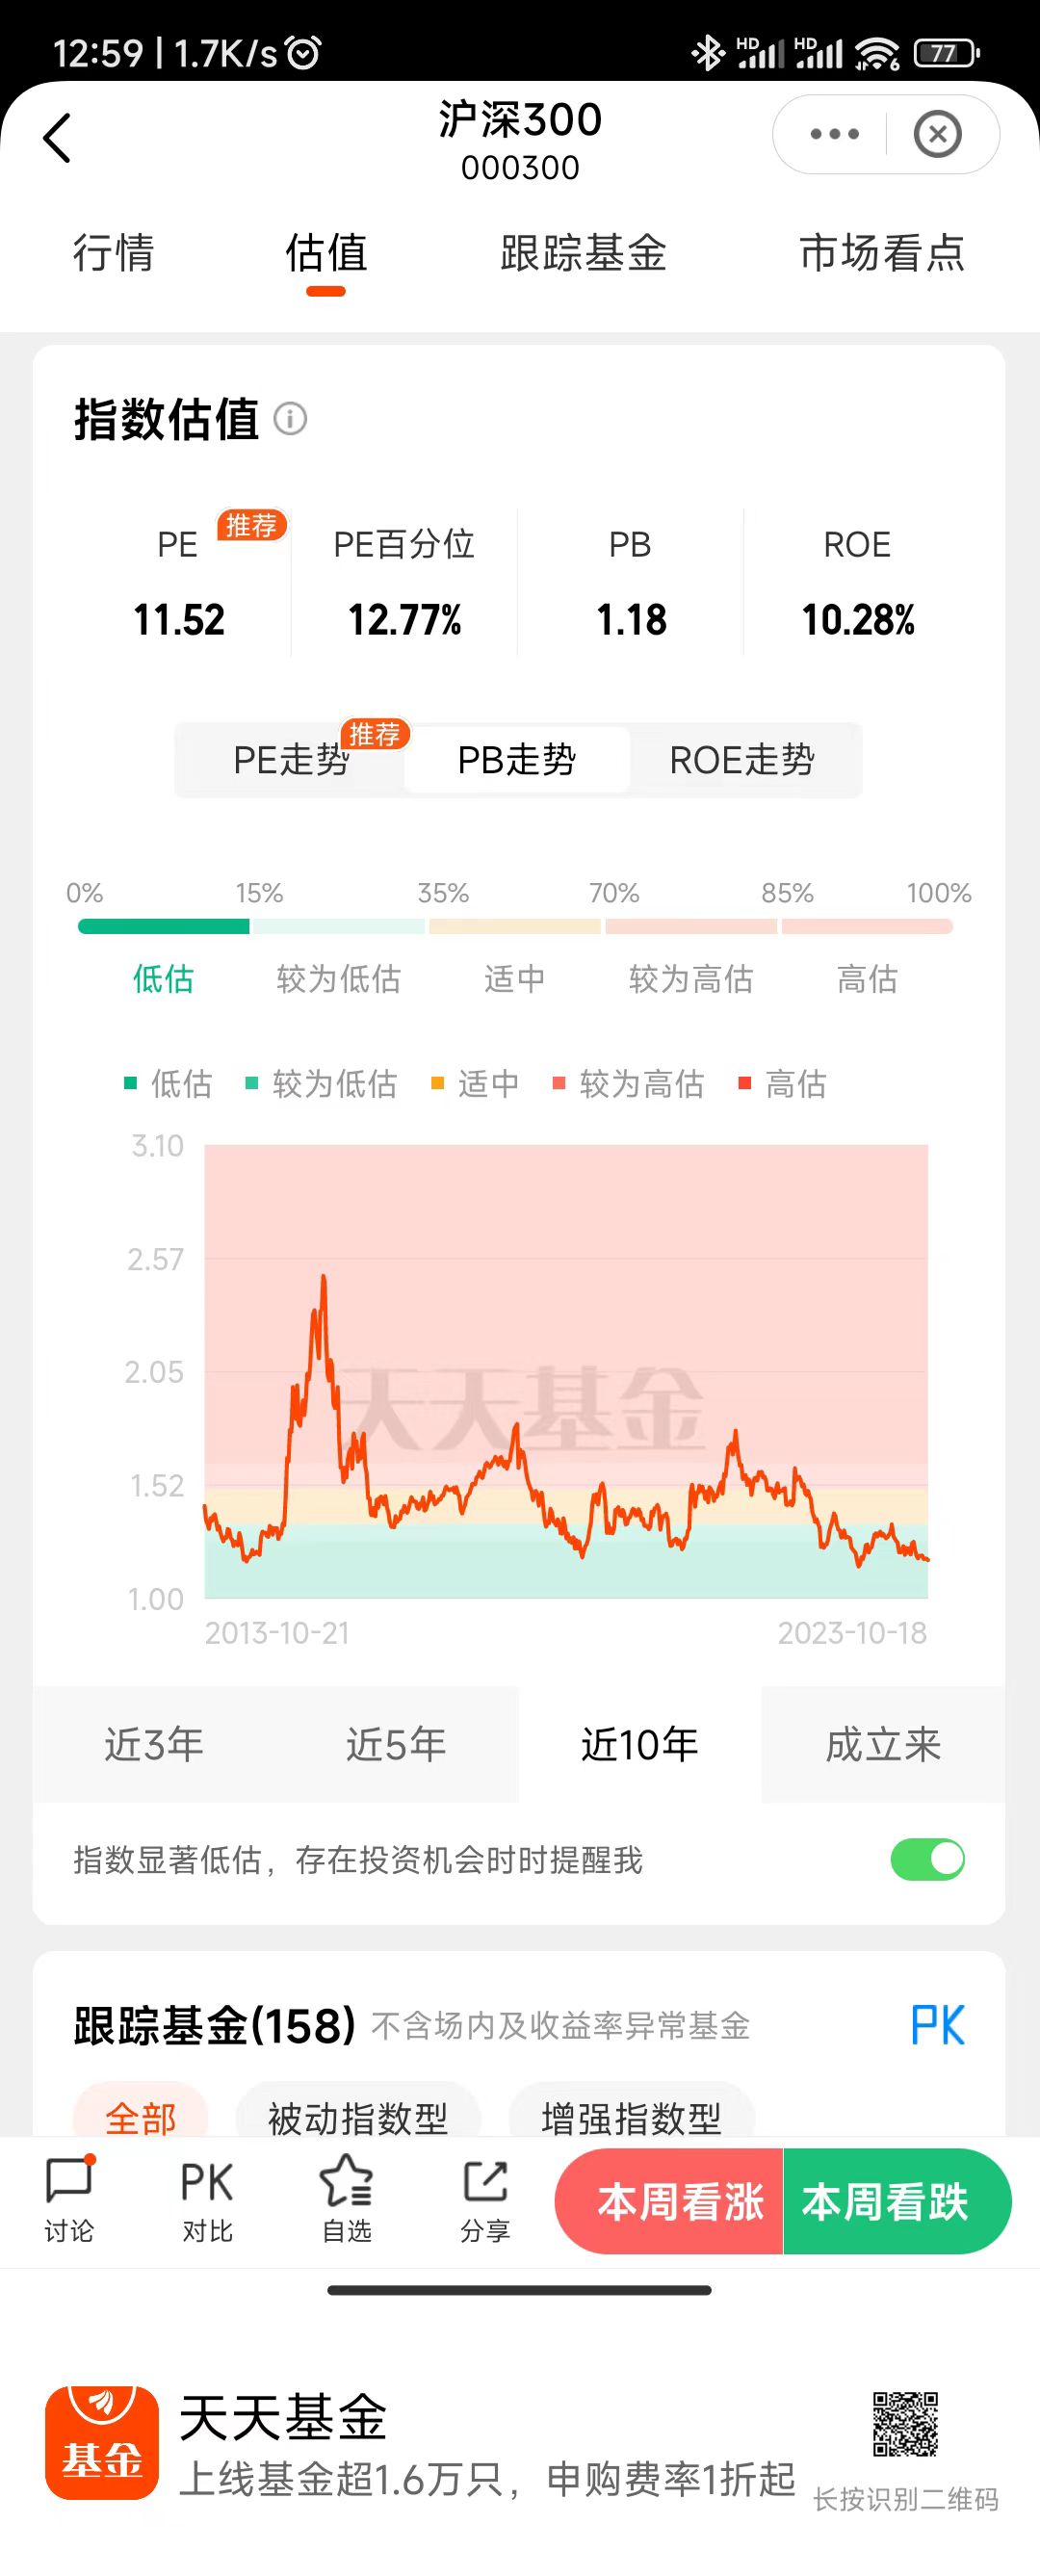
If you understand Bank螺丝钉’s investment views, you will know that valuation is very important.
Regular investment combined with valuation can enable us to obtain excess returns.
2. CSI 500
The CSI 500 index is a representative index that comprehensively reflects the mid-cap stocks in the Chinese stock market on the Shenzhen Stock Exchange and the Shanghai Stock Exchange. It consists of the 500 stocks with the highest total market capitalization after excluding the constituent stocks of the CSI 300 index and the top 300 stocks in terms of total market capitalization from the Shanghai and Shenzhen A-shares, aiming to reflect the overall performance of mid-cap stocks in the Chinese A-share market.
Simply put, the stock pool from the 301st to the 800th in terms of market capitalization forms the CSI 500.
The constituent stocks of the CSI 500 index are also weighted by market capitalization, with the weights ranked from largest to smallest. The constituent stocks of the CSI 500 index are mainly concentrated in industries such as industry, consumption, and pharmaceuticals. Compared with the CSI 300, the proportion of financial components has decreased significantly.
Tiantian Fund also has data and tables related to the valuation trends of the CSI 500 index.
According to the rules, it can be found that the market capitalization of the stocks in the CSI 500 is relatively smaller, that is, the so-called “small and mid-cap”. In the Chinese stock market, the proportion of retail investors is relatively higher than that in the US, and many are concentrated in small and mid-cap stocks. Therefore, the constituent stocks of the CSI 500 index often experience irrational rises and falls. By taking advantage of these irrational fluctuations, excess returns can be obtained.
According to historical data, when the stock market turns from a bear market to a bull market, the returns of the CSI 500 are often better than those of the CSI 300.
Hang Seng Index and H-share Index
Both the Hang Seng Index and the H-share Index are related to the Hong Kong Stock Exchange.
1. Hang Seng Index
The Hang Seng Index (HSI) is a representative index of the Hong Kong stock market. It was compiled by the Hang Seng Index Company on November 24, 1969. The index consists of the 80 companies with the largest market capitalization listed on the Hong Kong Stock Exchange and represents an important indicator of the Hong Kong stock market price.
The calculation method of the Hang Seng Index is to take a weighted average of the market capitalizations of the constituent stocks, with the weights calculated based on the number of outstanding shares and the total number of issued shares of each constituent stock. The unit of the index is “points”, and each point represents HK$100.
The trend of the Hang Seng Index reflects the overall situation of the Hong Kong stock market. When the index rises, it indicates that the Hong Kong stock market is generally rising; when the index falls, it indicates that the Hong Kong stock market is generally falling.
It is very similar to the SSE 50. For example, Tencent, which we are familiar with, is included in this index.
2. H-share Index
H-shares refer to stocks of companies registered in the Chinese mainland but listed in Hong Kong and traded in Hong Kong dollars. The full name is the Hang Seng China Enterprises Index.
So from the definition, it can be seen that there will be an overlapping part between the Hang Seng Index and the H-share Index, that is, some companies will be included in both indices.
3. QDII
As mentioned above, both the Hang Seng Index and the H-share Index are related to the Hong Kong Stock Exchange, so individuals cannot trade them directly. They can only trade through the Stock Connect and QDII.
Personally, I feel that QDII is more commonly seen, so I’ll briefly introduce it.
QDII stands for Qualified Domestic Institutional Investor, that is, a qualified domestic investor.
A QDII fund refers to a fund issued by eligible domestic institutional investors approved by the China Securities Regulatory Commission, with the investment currency being the Renminbi, and investing in overseas securities markets. The investment scope of QDII funds includes stocks, bonds, funds, etc.
Bank螺丝钉 described this model as “purchasing on behalf” in the book, which is quite vivid. Since individuals cannot trade, I give the money to institutions eligible to trade, and they will conduct the transactions.
Overall, QDII is a good investment channel. However, compared with ordinary funds, it also has certain risks, mainly as follows:
- QDII funds invest in overseas markets, so the investment risk is relatively high. Investors should fully understand the relevant risks and invest cautiously.
- The transaction costs of QDII funds are relatively high. Investors should pay attention to controlling transaction costs.
- The liquidity of QDII funds is relatively poor. Investors should make good investment plans to avoid being unable to redeem the funds in a timely manner when they need money.
NASDAQ 100 and S&P 500
When it comes to investing in funds, one cannot avoid the US market. Because for a long time, the US market has been leading the global market trends, and it still is.
The NASDAQ 100 index is compiled by the NASDAQ Stock Market in the United States, tracking the performance of the top 100 non-financial stocks in terms of market capitalization listed on the NASDAQ.
The constituent stocks of the NASDAQ 100 index are mainly concentrated in industries such as technology, the Internet, and healthcare. It also adopts the market-cap weighted method.
The S&P 500 index is compiled by Standard & Poor’s in the United States, tracking the performance of the top 500 stocks in terms of market capitalization listed on US exchanges.
The constituent stocks of the S&P 500 index cover all major industries in the United States and are an important indicator to measure the overall performance of the US stock market. Interestingly, the S&P 500 adopts the float-adjusted market-cap weighted method instead of the market-cap weighted method. This approach is not very common globally.
Investing in the funds corresponding to these two indices also faces the same problem as investing in the Hang Seng Index and H-share Index funds, and can only be invested through QDII.
Based on my own actual situation, as an ordinary non-professional salaried investor, it is sufficient to invest in the above-mentioned index funds plus a small amount of excellent sector index funds, and it doesn’t require spending too much time and energy on it.
For ordinary people, work is still the main source of income, especially when they are young. Never put the cart before the horse.